I’m thrilled to announce we have a fun data viz contest kicking off in July, but you can start right away!!
![]() Please Read: Full contest details, requirements, and rules can be found here: GOATs Data Viz Contest July 2025 Official Rules & Guidelines
Please Read: Full contest details, requirements, and rules can be found here: GOATs Data Viz Contest July 2025 Official Rules & Guidelines ![]()
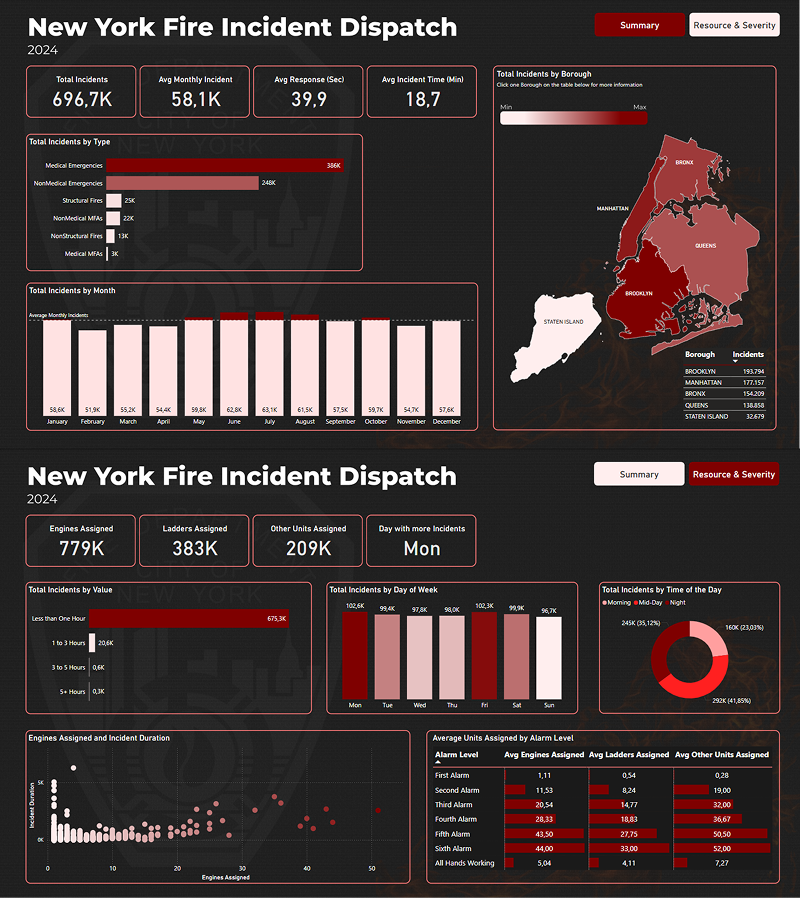
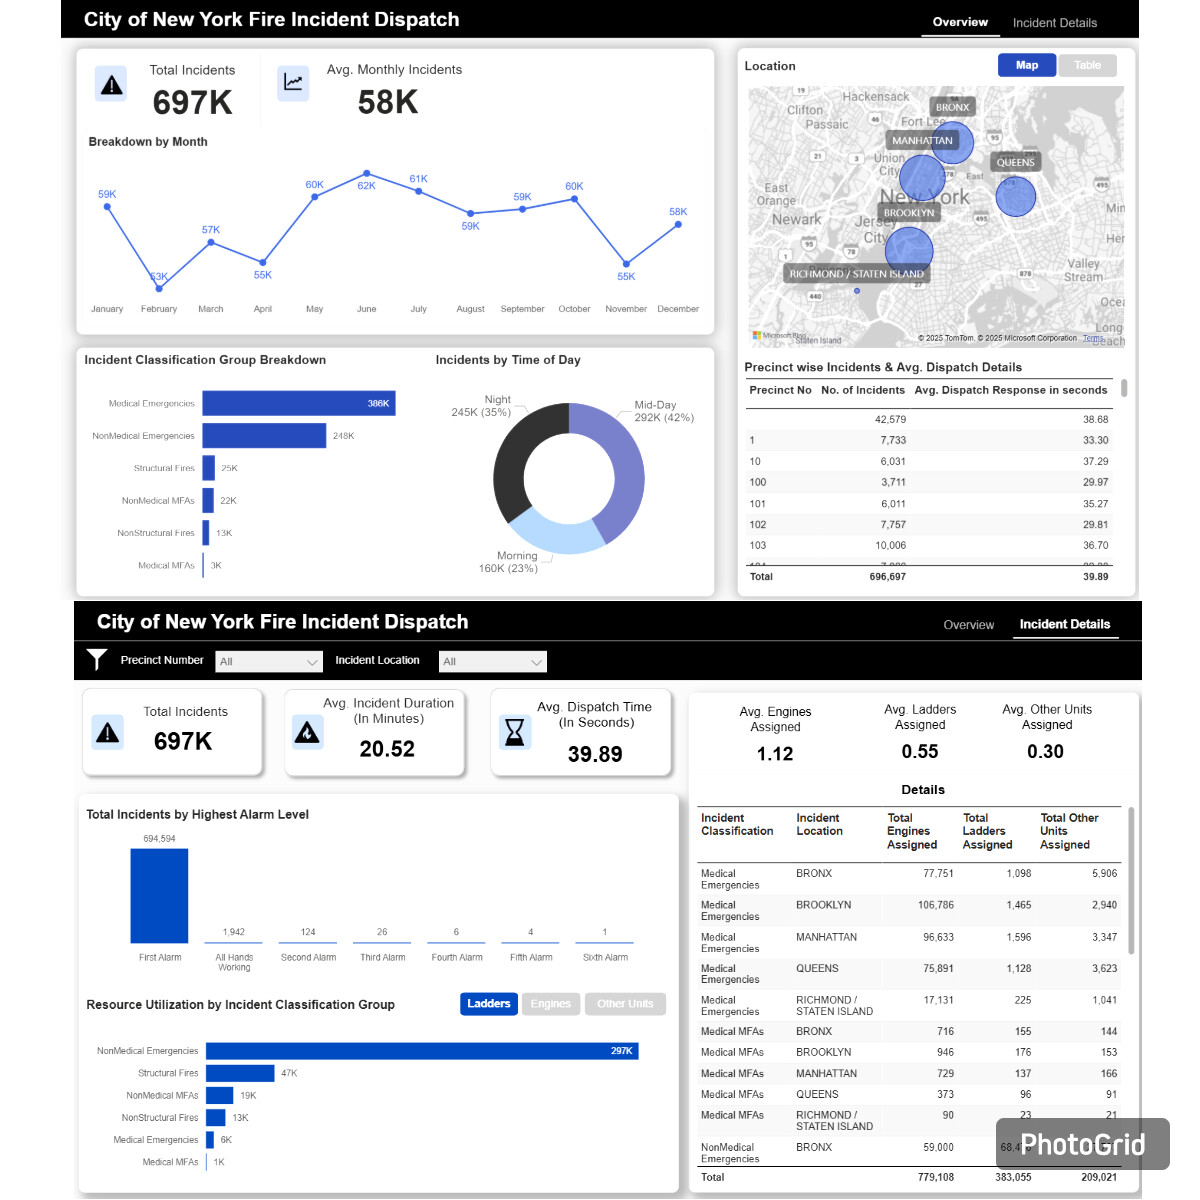
Utilizing City of New York Fire Incident Dispatch Data 2024 to 2025 (Download Here ~200MB)
Submission Deadline: Friday, July 25th, 2025, by 11:59 PM Pacific Time
Tools Allowed: Any data visualization tool of your choice (Tableau, Power BI, Excel, etc.), as long as submissions meet criteria and are shared with the judges in publicly accessible formats (more details in full official guidelines).
Eligibility: Open to all members (except judges) of the GOATs Community.
Prizes will be awarded to the top 3 Finishers
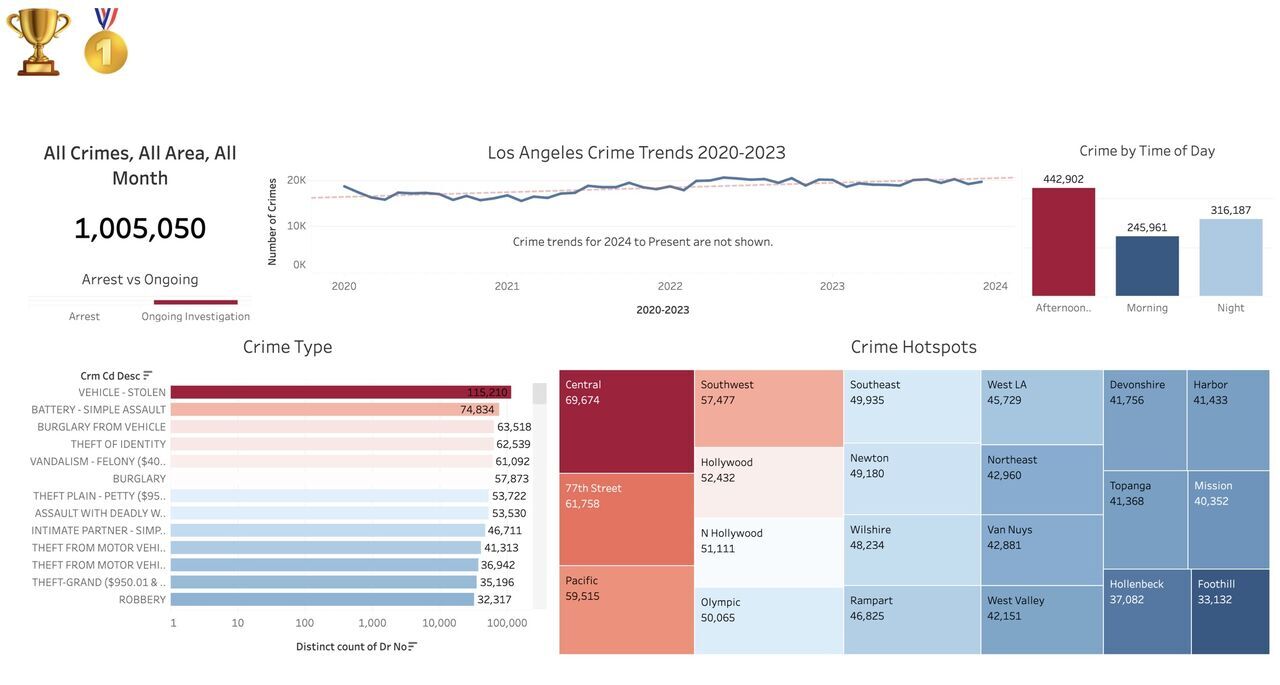
![]() 1st Place - 1 Year Subscription to LinkedIn Premium Career ($240 value!) - Find the right job faster, stand out to hiring managers, network with recruiters, see who’s been viewing your profile, and gain access to ‘LinkedIn Learning’ with over 24k courses to choose from to grow your career. Plus: A Real Physical GOATs 1st Place TROPHY
1st Place - 1 Year Subscription to LinkedIn Premium Career ($240 value!) - Find the right job faster, stand out to hiring managers, network with recruiters, see who’s been viewing your profile, and gain access to ‘LinkedIn Learning’ with over 24k courses to choose from to grow your career. Plus: A Real Physical GOATs 1st Place TROPHY
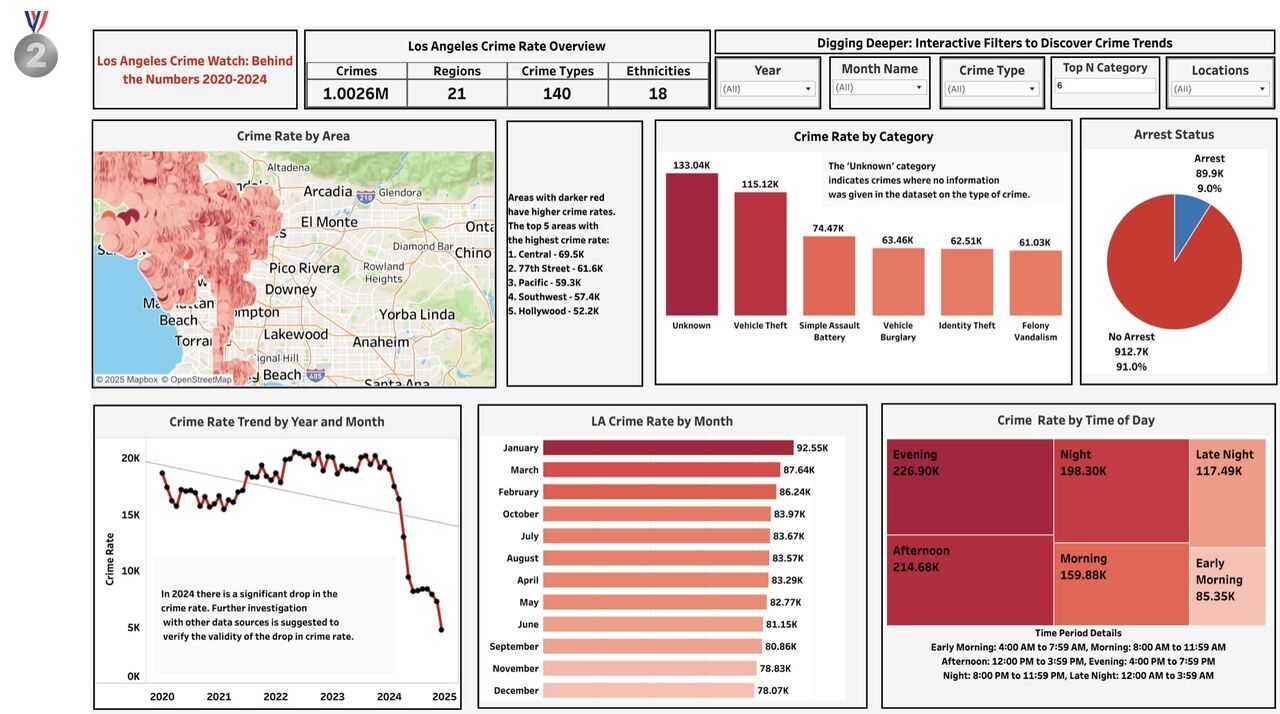
![]() 2nd Place - 1 Year Subscription to Olga Berezovsky’s Data Analysis Journal ($120 value!) - weekly newsletters, mentorship, Q&A, cheatsheets and more! Plus: A Real Physical GOATs 2nd Place Medal
2nd Place - 1 Year Subscription to Olga Berezovsky’s Data Analysis Journal ($120 value!) - weekly newsletters, mentorship, Q&A, cheatsheets and more! Plus: A Real Physical GOATs 2nd Place Medal
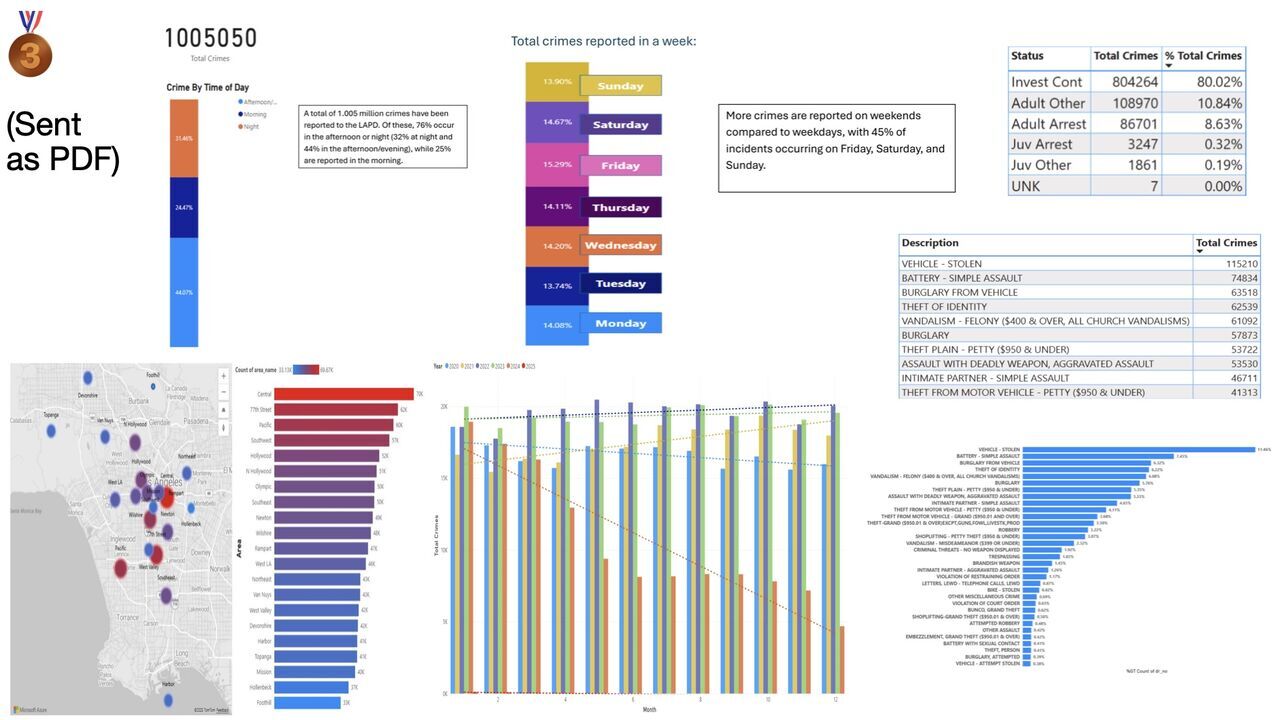
![]() 3rd Place - Two free courses of your choosing on Analyst Builder ($88 value!) - a great place to build analytics skills for a reasonable price. Plus: A Real Physical GOATs 3rd Place Medal
3rd Place - Two free courses of your choosing on Analyst Builder ($88 value!) - a great place to build analytics skills for a reasonable price. Plus: A Real Physical GOATs 3rd Place Medal
To Submit Your Entry, create a reply below with your submission. Make sure your submission follows all of the official guidelines.